










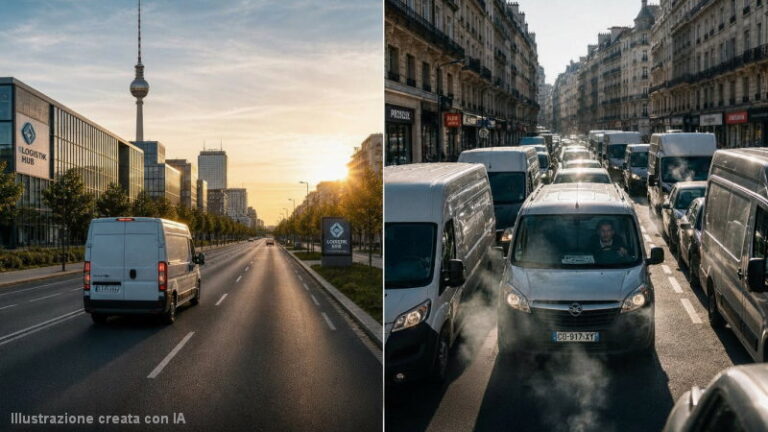
- Geotab has published its first index of urban freight transport efficiency in Europe, based on full-year 2025 data collected from a fleet of 36,000 connected vehicles in seven capitals. The gap between the best-performing city, Berlin, and the worst-performing one, Madrid, reaches 144%, with direct consequences for operating costs, fuel consumption and emissions.
- Rome ranks fourth with 48 points, in what appears to be a contradiction: it records the highest congestion in the sample but also the widest gap between commercial vehicles and private cars, at 26 points. Urban access restrictions and structured delivery windows have forced logistics operators to plan far more precisely than in other European contexts.
- The index overturns the traditional interpretation of urban logistics efficiency: congestion alone is not enough to explain fleet performance. What matters is traffic predictability. In cities where journey times vary significantly from one day to the next, a “structural tax” is created that no route optimisation can fully eliminate.
Berlin is the most efficient European capital for urban freight transport. This is the finding of the first urban freight transport efficiency index in Europe, published by Geotab in May 2026. The study, entitled “The cost of traffic”, analyses full-year 2025 data collected from around 36,000 connected vehicles operating in seven European capitals: Berlin, Amsterdam, Dublin, Rome, Paris, London and Madrid. The most notable result is the 144% efficiency gap between the highest-ranked city and the worst-performing one, a spread that translates into longer journey times, higher fuel consumption and greater operating costs for fleets working in less fluid urban environments.
The index gives each city a score from 0 to 100, built around two main dimensions. The first, weighted at 75%, concerns traffic flow and combines three variables: cumulative congestion over the course of the day, hours of free-flowing traffic and journey time variability. The second dimension, accounting for the remaining 25%, measures idling time as an indicator of the economic cost of congestion. Scores are calculated separately for cars and commercial vehicles, then combined with a 60-to-40 weighting in favour of cars, as they account for the largest share of road demand. The commercial vehicle component specifically captures logistics efficiency. Fuel costs during stops were estimated on the basis of average 2025 pump prices published in the Weekly Oil Bulletin of the European Commission for EU cities, and in the corresponding dataset from the UK Government for London.
Berlin achieves the highest, and therefore best, score, with 61 points out of 100, thanks to a polycentric urban structure that distributes flows across several autonomous logistics nodes, avoiding the formation of a single central bottleneck. Traffic is not only free-flowing but, above all, predictable: journey time variability is limited, enabling fleets to plan deliveries with smaller margins of error. Harsh driving events, meaning sudden acceleration and braking, stand at 225 per 1,000 journeys, the lowest figure in the entire sample. Commercial vehicles score 16 points higher than private cars, confirming that the city environment favours professional fleet management.
Amsterdam follows with 59 points, almost matching Berlin. The Dutch capital does not have the space available to its German counterpart, but it benefits from short routes, optimised regulation and traffic light synchronisation that allows vehicles to keep moving, even at low speeds, without stopping. Its route inefficiency score is the lowest in the European sample, indicating that wasted time during journeys is kept to a minimum. However, the analysis highlights a geographical anomaly: 13.7% of all harsh braking and acceleration events in the city are concentrated around the Schiphol junction, a finding that enables companies to reschedule movements through that critical point during more favourable time slots.
Dublin ranks third with 49 points, in a moderate efficiency band that nevertheless conceals a sharp internal divide: private cars score 43, while commercial vehicles reach 57. This 14-point gap reflects the contribution of telematics platforms and professional routing, which offset the shortcomings of a road network that has now exhausted its natural capacity to absorb traffic.
Rome ranks fourth with 48 points and is the most complex case in the entire study. The Italian capital records the highest congestion in the sample, with a score of just 39 for traffic volume, but at the same time achieves the best result overall for pure route efficiency, with 74 points. The reason lies in the nature of Roman traffic itself: slow, but continuous. Unlike other metropolitan areas where flows alternate between prolonged standstills and abrupt restarts, vehicles in Rome continue to move steadily even at peak times, reducing the impact of idling to 13.2% of total fuel consumption, with average consumption of 11.06 litres per 100 kilometres. The most important figure from an operational point of view, however, is the 26-point gap between commercial vehicles and private cars: the widest recorded anywhere in Europe. According to the Geotab index, this result is directly linked to urban access rules: in Rome, deliveries planned in compliance with time windows and limited traffic zones outperform unstructured deliveries more than in any other city in the sample. Restrictions that appear to complicate logistics have in fact pushed professional operators towards a level of planning that translates into a measurable advantage.
Paris scores 37 points and presents the opposite situation. Traffic variability is limited, with the predictability index standing at 83, indicating that congestion is constant and therefore, to some extent, foreseeable, but the resulting costs are the highest in the sample. Some 18.2% of the fuel consumed by fleets is burned while vehicles are stationary with engines running, without goods moving a single metre: the worst figure in the entire study. Road conditions have a direct impact on driver behaviour: with 1,191 harsh driving events per 1,000 journeys, Paris has the highest level of driving stress, 5.3 times higher than Berlin. Commercial fleets still score 15 points higher than private cars, but the scale of the fixed costs linked to congestion erodes much of the available margin.
London falls to 29 points, second from bottom in the ranking. Congestion Charge and Ultra Low Emission Zone policies have helped reduce emissions, but they have not solved the structural problem of road capacity. Goods movement suffers from chronic journey fragmentation, with longer delivery times that logistics optimisation struggles to offset substantially. The constant alternation of stops and restarts generates higher fuel consumption and additional emissions that no route planning can fully eliminate without resorting to night-time delivery shifts.
Madrid is last in the ranking with 25 points. The Spanish capital shows systemic saturation, with commercial vehicles having neither reserved lanes nor structured access windows. Harsh driving events approach 1,080 per 1,000 journeys, evidence of a road network in which conflict between private and commercial traffic is high. The advantage of professional fleets over cars is the smallest in the sample, a sign that the urban environment offers logistics operators no preferential lane, either physical or regulatory, compared with general traffic.
The report’s overall reading suggests a change of perspective from the traditional narrative on urban logistics. Congestion itself is not necessarily the determining factor in fleet performance: predictability is. In cities where journey times vary considerably from one day to the next, what Geotab defines as a “structural tax” on fleet operations is created, seen in missed delivery windows, dead time between deliveries and efficiency losses that cannot be resolved by optimising routes or improving driver training.
Berlin and Amsterdam show that predictability can result from urban planning choices: the decentralisation of logistics nodes in the German case, and traffic light optimisation in the Dutch one. Rome, meanwhile, shows that even a highly congested system can be efficient for logistics, provided urban access rules are structured enough to differentiate fleets from private traffic.
“Urban freight transport has always been interpreted through the lens of traffic, looking at how congested a city is and how much traffic slows during peak hours,” said Franco Viganò, Associate Vice President EMEA at Geotab. “Our index shows that the issue goes deeper: it is not only the amount of traffic that matters, but the way it moves. In the most efficient cities, circulation is fluid and predictable; in others it becomes fragmented, and this discontinuity has a direct impact on costs, emissions and the ability of fleets to operate effectively.” Viganò added that connected vehicle data makes visible what previously was not, enabling fleets, cities and decision-makers to make more informed choices about the development of urban transport systems.
If the entire logistics system of the capitals examined were able to align with Berlin’s standards, overall efficiency would rise by 39%, with a direct reduction in operating costs and CO2 emissions in urban areas. According to Geotab data, this outcome depends primarily not on the adoption of electric vehicles, but on reducing the time vehicles spend stationary with engines running: the factor that, more than any other, determines the gap between the best-performing capitals and those facing the greatest difficulties.
Pietro Rossoni