










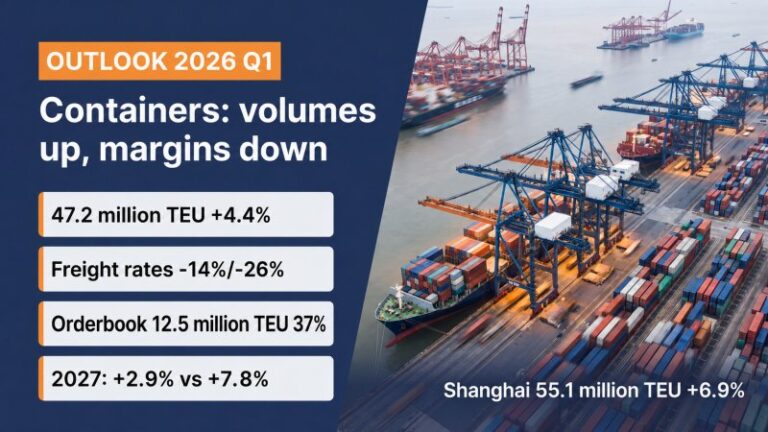
- Global container shipping volumes rose by 4.4% in the first quarter of 2026, to 47.2 million TEU: demand is holding up, but excess fleet capacity is squeezing pricing power and shipowners’ profitability, according to the Global Container Shipping Outlook 2026.
- The containership orderbook has reached 12.5 million TEU, equal to 37% of the existing fleet in service: a record that, according to the report, will push capacity growth ahead of demand until 2027, when the gap between the two indicators, 2.9% demand growth compared with 7.8% fleet growth, will reach the widest level ever forecast.
- Profitability among shipowners is diverging sharply: Maersk is reporting rising Ocean volumes but sharply lower margins, Zim has suffered the steepest rate collapse and closed with a net loss, while Cma Cgm has maintained the highest margin thanks to diversification across shipping, terminals and integrated logistics.
Container shipping continues to grow despite geopolitical tensions. The sector ended the first quarter of 2026 with global volumes up 4.4% year on year, at 47.2 million TEU. Demand is holding up, but shipowners’ profitability is narrowing under the weight of what has now become a structural surplus in vessel capacity: this is highlighted by Maritime Analytica’s Global Container Shipping Outlook 2026, according to which the global containership orderbook has reached 12.5 million TEU, equal to 37% of the existing fleet in service, the highest share ever recorded. This is happening in a context in which the global economy is stabilising around moderate growth, driven by emerging Asian economies and US demand that the report considers resilient, with US gross domestic product estimated to grow by 2.3% in 2026. The global manufacturing PMI for April points to an acceleration in output and new orders to their highest levels since 2022, although supply chain delays are intensifying because of disruptions in the Middle East.
The document also describes a geopolitical fragmentation of trade: in the first quarter, goods trade between the United States and China fell by $49 billion (€43.1 billion), the steepest decline among the routes monitored, directly benefiting Taiwan, up $39 billion (€34.3 billion), Vietnam, up $18 billion (€15.8 billion), and Mexico, up $16 billion (€14.1 billion). The United States is therefore reducing its direct dependence on Chinese imports, shifting flows towards South-East Asia and the North American bloc. However, the gap between containership fleet growth and volume growth continues to widen, the study warns: for 2026, demand is expected to rise by 2.9%, while capacity will grow by 3.9%. In 2027 the gap is set to widen further, with demand steady at 2.9% and capacity growing by 7.8%. It is above all this second figure, described by the document as a significant anomaly, that represents the main risk to the sector’s future margins.
On the rates side, spot indices such as the Scfi have shown high volatility, driven by security-related events in the Strait of Hormuz and the Red Sea and by fuel costs. Crises in these two areas have absorbed part of the excess vessel capacity, removing 840,000 TEU of capacity in March alone because of the Gulf crisis. Contract indices such as the Ccfi, however, are struggling to recover, owing to the lack of real pricing power among shipowners in an oversupplied market.
As regards company accounts, the report describes a transition towards what it calls a “new normal”: Maersk led Ocean volume growth with a 9.3% increase, but its average freight rate fell by 14%, pushing Ebit in the maritime division into negative territory. The Logistics and Terminals segments helped balance the picture, maintaining solid margins: Maersk’s Terminals division closed the quarter with an Ebitda margin of 33.2%. Companies more exposed to the spot market paid the highest price. Zim, the document notes, recorded the sharpest rate decline among the operators analysed, with a 26% fall in its average rate, and ended the quarter with a net loss. Cma Cgm, by contrast, thanks to a diversified platform spanning vessels, terminals and logistics, maintained the highest maritime Ebitda margin among the main carriers, at 18.6%.
The historical comparison between Maersk’s two divisions highlights the change under way: the Ebitda margin of the Ocean division, which had reached a peak of 55.1% in 2022, has fallen to 11.0%, converging with the 11.4% recorded by the Logistics division. On the stock market, the divergence is reflected in market capitalisations: Maersk’s has risen to $33.8 billion (€29.7 billion), while Hapag-Lloyd’s has fallen to $23 billion (€20.2 billion).
The ranking of the main ports confirms Asia’s dominance in container handling. Shanghai remains in first place with 55.1 million TEU handled in 2025, up 6.9%, ahead of Singapore, which returned to 44.7 million TEU after last year’s rebound. Six of the world’s top ten ports are Chinese and all are growing, while the only Western port complex in the top ten, Los Angeles/Long Beach, recorded an increase of just 0.9%.
Mara Gambetta