









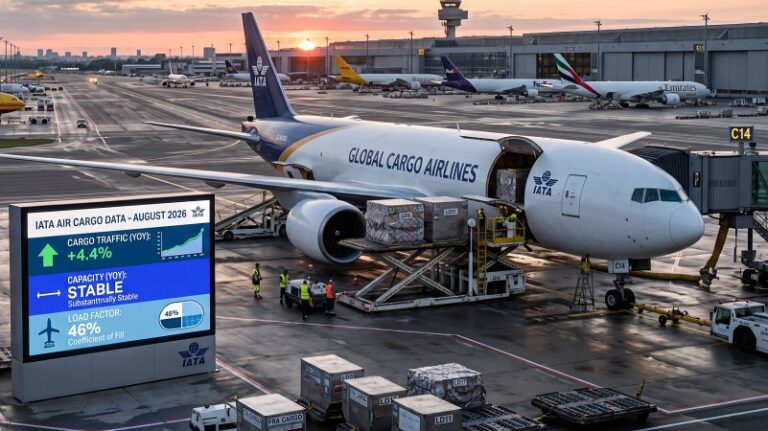
More cargo flying in aircraft holds that are not expanding: this sums up IATA’s air cargo report for August 2026, when global demand, measured in cargo tonne-kilometres (CTKs), recorded a 4.4% increase compared with the same month in 2025, while available capacity, measured in available cargo tonne-kilometres (ACTKs), remained broadly unchanged (-0.1%). This pushed the global cargo load factor up by two percentage points to 46%. Over the first eight months of the year, traffic increased by 4.6%, compared with a 1.5% rise in capacity, with an average load factor of 46.4%.
Growth extended across all regions, although the centre of gravity remained in the two largest markets: North American and Asia-Pacific airlines together generated 72.3% of global growth, adding 387.5 million and 371.5 million CTKs respectively, while European carriers contributed a further 209 million. Latin America and the Caribbean recorded growth of 5.1%, which, given their smaller market base, translated into just 34.7 million additional CTKs. Growth was more limited in the Middle East (+1%) and Africa (+3%).
International traffic alone grew by 5.3%. North American carriers led the way with a 10.1% increase, accelerating by 1.8 percentage points from July, while Asia-Pacific rose by 5.5%. Latin America and the Caribbean (+4.8%) and Africa (+3%) also strengthened, indicating, according to the airline association, that the improvement is spreading beyond the two main contributors. Europe remained positive at +4.3%, with a slight slowdown that IATA sees as a sign of stability rather than renewed momentum. The Middle East remained at the bottom of the table, with international traffic up 1% and growth slowing by 0.9 percentage points.
Analysis by trade lane, covering all airlines operating on a route regardless of nationality, confirms the strength of the transpacific market: traffic between Asia and North America increased by 13.2%, accelerating by 1.6 percentage points. This was the seventh consecutive month of growth and the fourth with a double-digit increase. Europe’s two main corridors were more subdued, with Europe-Asia unchanged at +3.1%, the same rate as in July and well below the double-digit growth recorded during the previous eleven months. IATA notes that the slowdown coincided with the European Union’s abolition, from 1 July 2026, of the de minimis customs exemption for parcels worth up to €150. The €3 duty introduced on low-value imports may have dampened e-commerce flows into Europe. Traffic between Europe and North America rose by 4.3%, the best result in the past 17 months.
The situation on Middle Eastern corridors deteriorated, affected by the conflict between the United States and Iran. Traffic between the Middle East and Asia fell by a double-digit 14.6%, while traffic between Europe and the Middle East declined by 15.1%. Both contractions deepened compared with July and have now persisted for six months. The recovery among carriers based in the region, the association notes, has not been enough to offset losses on the main international routes, and traffic handled by Middle Eastern airlines remains down 6.5% since the start of the year.
On the capacity side, the slight global decline reflected sharply diverging regional trends. Europe and North America withdrew a combined 756.14 million ACTKs, with capacity falling by 3.5% and 2.5% respectively, more than offsetting increases elsewhere. In Africa, capacity rose by 14%, accelerating by 9.5 percentage points from the previous month.
These cuts produced the strongest improvements in load factors. European carriers, which increased traffic while reducing available capacity, raised their load factor to 53% (+3.9 percentage points), the highest among all regions, while North American airlines reached 42% (+3.6 points). In Asia-Pacific and Latin America, the increase came from demand growing faster than capacity, which nevertheless continued to expand: load factors reached 48.6% and 34.9% respectively, gains of 1.5 and 0.6 percentage points. The Middle East moved in the opposite direction, falling to 43.1% (-1 point), while Africa recorded the sharpest decline, down 3.9 points to 36.5%, as capacity grew far more rapidly than traffic.
Fuel is weighing on airlines’ operating costs. In August, jet fuel reached $157 a barrel, its highest level in three months and the highest August figure in 13 years, up 8.3% from July and 79.2% year on year. Brent Dated gained $7.4 compared with July to average $90.8 a barrel (+8.9% month on month and +33.1% year on year). According to IATA, the rise coincided with persistent supply difficulties in the Persian Gulf, tighter measures against vessels trading with Iran, and attacks on maritime traffic and energy infrastructure in the region. The crude oil crisis was compounded by pressure on refining: the spread between jet fuel and crude oil prices reached $65.8 a barrel, a four-month high and the highest August level in 13 years, representing an annual increase of 240.9%. The association says it is this pressure, rather than crude prices alone, that is magnifying the surge in costs, driven by reduced availability of middle distillates because of disruptions to Middle Eastern export routes, lower Russian exports and competition from diesel production.
By contrast, air cargo yields recovered. Average dollar yields, including surcharges, rose by 1.3% compared with July, ending three consecutive months of decline, and stood 24.9% above the previous year’s level. This was the sixth consecutive month of double-digit year-on-year growth. IATA interprets the monthly recovery as renewed short-term resilience, with stronger yields supporting revenues as fuel pushes operating costs higher.
The association says the industrial backdrop remains favourable. The global manufacturing output Purchasing Managers’ Index (PMI) rose by 0.3 points to 53, while the new export orders index gained 1.4 points to reach 51.4, according to S&P Global. Both remained above the 50 threshold separating expansion from contraction, with the association identifying export orders as the more direct indicator of demand for international air transport. The World Trade Monitor published by the Netherlands Bureau for Economic Policy Analysis (CPB) shows global trade volumes rising by 0.3% month on month for the fourth consecutive month and by 6% year on year, extending the annual growth streak to 33 months. Global industrial production was unchanged in July compared with June but stood 3.1% above its July 2025 level, extending its run of annual growth to 41 months.
Anna Maria Boidi