







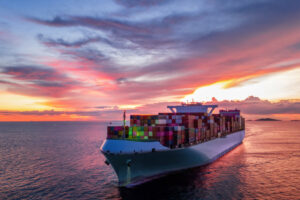

In 2025, container ships spent 46.5% of their time in port outside cargo operations, including waiting at anchor, approaching their berth and remaining alongside without handling cargo. Loading and unloading accounted for the remaining 53.5%. This figure opens the analysis in the Container Terminal Performance Improvement Guide, published in 2026 by the World Bank with data and analysis from S&P Global Market Intelligence. The guide explains how to identify and remove constraints on container terminal capacity, often without building new infrastructure. The authors argue that better planning, maintenance, workforce organisation and coordination with shipping lines and authorities should precede or accompany investment in expansion.
The proportion of time spent outside loading and unloading varies with vessel size. Cargo operations account for 36.9% of port time for vessels below 1,500 TEU, rising to as much as 66% for those above 13,500 TEU, while the arrival phase falls from 41.2% to 18.2%, respectively. Across the full sample, based on data from eleven liner operators representing between 75% and 80% of global fleet capacity, arrival takes an average of 16.4 hours: 12.3 hours waiting and 4.1 hours approaching the berth. A further 2.1 hours elapse between berthing and the first container move, and 2.3 hours between the last move and departure from the berth. Average productivity is 44.8 moves per hour in port and 56.3 per hour alongside, with an average of three cranes deployed per vessel and 23.5 moves per gross crane hour. The World Bank cautions that these are descriptive averages, which must be interpreted in relation to vessel size, call volumes and the terminal’s role. Indicators covering total port time also reflect the work of port authorities, pilots, tug operators and inspection agencies, so they do not measure terminal operator performance alone.
The study stresses that a container terminal’s effective capacity is determined by its weakest component, whether that is the quay, cranes, yard, handling equipment, workforce or gates. A terminal may have sufficient berth space but too few trained crane operators, modern cranes but unreliable yard equipment, or available yard space but slow gates. Improving just one link in this chain risks shifting congestion elsewhere. To identify each terminal’s bottleneck, the authors propose a clear sequence: establish a baseline using consistent indicators; compare performance with terminals serving similar functions, vessel sizes and traffic; observe operations directly across different shifts; isolate the constraint and its causes; take action; and use an agreed indicator to verify that the improvement benefits the whole system rather than a single local metric. Each component should have a documented capacity calculation, consolidated in a single tool updated monthly with container dwell times, stacking heights, equipment and workforce availability, and gate transit times.
The first step is berth planning, which determines requirements for cranes, yard space, staff and equipment. Even during relatively stable periods, around 25% of container ships arrive at the berth a day earlier or later than forecast two weeks beforehand, and a deviation of just four to six hours can push a vessel outside its allocated window. The World Bank therefore recommends distinguishing between the long-term plan, with recurring windows for each liner service, and the operational plan, which should be reviewed daily for the following fourteen days. Late vessels should be accommodated in the next available window without rescheduling other services in a chain reaction that would multiply the effects of the delay.
Alongside, the number of cranes must reflect the distribution of work across the vessel. For example, a call involving 1,250 moves takes 26 hours with two cranes and 20 hours with a third, while vessel productivity rises from 48.1 to 62.5 moves per hour, an increase of around 30%. Too many cranes, however, interfere with one another, congest the yard and reduce individual crane productivity. During operations, the report recommends managing horizontal transport equipment as a shared pool, dynamically allocated by the terminal operating system across vessels, quays and yard areas. Productivity gains range from 10% to 20%, depending on the configuration and the skills of equipment dispatchers. For frequent failures, such as spreader faults, the best approach is to replace the component and repair it off-line.
In the yard, the report’s authors advise against unloading all containers when information or cargo arrives after the cut-off, as this increases yard occupancy. Where possible, containers due to be reloaded shortly should remain on board or be reloaded first. For onward container movements, gate improvements are often among the least costly options. The document recommends introducing truck appointment systems, extended opening hours, dual transactions allowing trucks to deliver an export container and collect an import container in the same visit, dedicated lanes, advance information and automatic recognition of containers, chassis and number plates. When a breakdown or volume surge reduces yard capacity, gates should regulate entry against a predefined limit on the number of trucks and close once that limit is reached, preventing congestion from spreading throughout the terminal.
One chapter covers staffing, recommending that core workforce levels match minimum demand, with peaks covered through training on multiple equipment types, apprenticeships, pools of casual workers and targeted outsourcing, for example for lashers and terminal tractor drivers. Operator handovers directly at the equipment, with staff required to be present fifteen minutes before and after their shift in return for an allowance, reduce interruptions without capital investment. Eight-hour shifts are the most common, while twelve-hour shifts require careful fatigue management. The authors do not recommend the six-hour shifts used in Spain, Italy and Greece as a model.
In maintenance, it is normal for large terminals to have between 10% and 15% of the equipment in each category out of service for scheduled or corrective work. Realistic availability ranges from 90–95% for quay cranes and rail-mounted gantry cranes to 80–90% for straddle carriers, rubber-tyred gantry cranes, terminal tractors and forklift trucks. Availability is higher for electric equipment, at 85–95%, than for equipment with internal combustion engines, at 80–90%. The report recommends recording each stage of downtime separately, from the breakdown to notification of the workshop, the technician’s arrival, the repair and the return to service. Equipment undergoing lengthy repairs should remain in the calculation, as excluding it makes availability appear higher than it actually is.
Some bottlenecks stem from shipping lines, as late or incorrect stowage data, arrivals outside allocated windows and containers delivered after cut-offs generate additional moves. The document therefore proposes including shipping lines’ obligations in service-level agreements, applying progressively higher charges for late deliveries and linking handling charges to time alongside.
Antonio Illariuzzi