


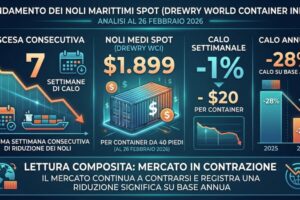

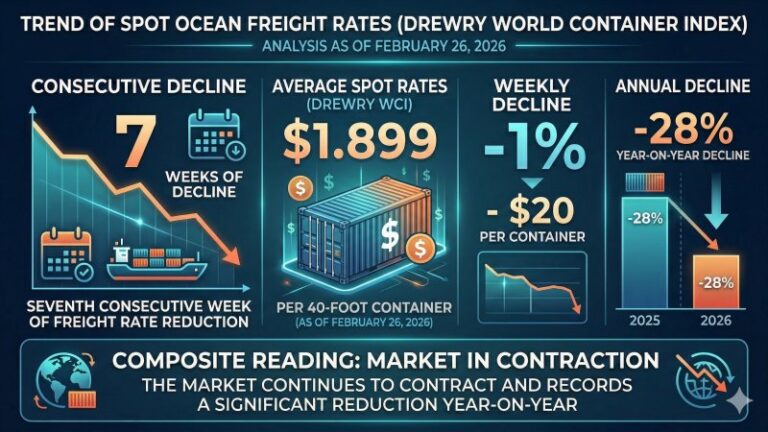
Average spot container shipping rates, as measured by the Drewry World Container Index, continued their downward trend for the seventh consecutive week, reaching 1,899 dollars per 40ft container on 26 February 2026, down 1 per cent week on week, or 20 dollars. The composite reading points to a market that is still contracting and, on an annual basis, shows a 28 per cent reduction. The data confirm that the rebalancing between demand and vessel capacity remains incomplete, with rates well below levels seen twelve months ago.
Downward pressure is most evident on the Asia–Europe corridor, where the seasonal recovery in volumes after Chinese New Year has not, for now, translated into higher rates. On the Shanghai–Rotterdam route, the average rate stands at 2,094 dollars per feu, down 1 per cent week on week and 19 per cent year on year. The correction is even more pronounced on Shanghai–Genoa, which has fallen to 2,826 dollars per feu, with a 2 per cent weekly decline and a 25 per cent annual drop.
The key factor remains the imbalance between capacity and demand. Excess supply continues to weigh on prices and keeps the market “soft”, despite expectations of a rebound in volumes in March as Asian manufacturing returns to full capacity. Operationally, this combination suggests that seasonality alone is not sufficient to reverse the cycle if vessel capacity remains elevated. Rate dynamics therefore appear to be driven more by the structure of supply than by short-term fluctuations in cargo volumes.
On the Transpacific, the picture is different. Structural weakness is accompanied by tactical capacity management aimed at limiting further declines. The Shanghai–Los Angeles rate stands at 2,191 dollars per feu, down 1 per cent week on week and 37 per cent year on year. Shanghai–New York is at 2,771 dollars per feu, stable week on week but down 40 per cent year on year, the steepest annual fall among the reported trades.
Weekly stability on the East Coast, however, should not be interpreted as a recovery but rather as a possible effect of measures announced by carriers, including nine blank sailings scheduled for the following week on Transpacific routes to both the West and East Coast. The aim of these cancellations is to support prices during the post–Chinese New Year volume normalisation. In practical terms, short-term resilience depends on capacity discipline: if cancelled departures effectively reduce available supply, rates may stabilise even without demand growth. The impact, however, depends on the continuity of these measures and on market reaction.
Adding further complexity to the Transpacific outlook is political risk. The Trump administration has imposed an immediate global tariff of 10 per cent, with projections rising to 15 per cent, after the Supreme Court declared last April’s tariffs illegal. As presented, this variable introduces regulatory uncertainty that could “drastically alter future flows”. From a logistics perspective, such uncertainty tends to affect planning, booking lead times and the potential bringing forward or postponement of shipments, with indirect consequences for vessel utilisation and spot rate volatility. The WCI figures and individual route data do not yet reflect a shock of this nature, but the explicit reference to political risk highlights that freight levels are shaped not only by maritime fundamentals but also by expectations around trade policy.
On the Transatlantic, trends are more nuanced and include the only double-digit annual increase among the main corridors. Rotterdam–New York stands at 1,602 dollars per feu, down 1 per cent week on week and 33 per cent year on year. In the opposite direction, New York–Rotterdam is at 958 dollars per feu, stable week on week and up 15 per cent year on year. This divergence is interpreted as a sign of export demand from the United States to Europe that is more resilient than the global average. The coexistence of a sharp decline on the Europe–United States leg and an increase on the reverse route indicates that the market does not move symmetrically. Cargo flows and load factors can influence rate levels differently depending on direction, with practical implications for those managing bilateral supply chains and negotiating conditions for headhaul and backhaul movements.
The ranking of variations in the data helps distinguish between underlying trends and short-term movements. The largest annual decline is on Shanghai–New York, down 40 per cent to 2,771 dollars per feu, while the steepest weekly fall is on Shanghai–Genoa, down 2 per cent to 2,826 dollars per feu. The strongest annual increase is on New York–Rotterdam, up 15 per cent to 958 dollars per feu.
In terms of weekly stability, Shanghai–New York remains at 2,771 dollars per feu, Los Angeles–Shanghai at 726 dollars per feu and New York–Rotterdam at 958 dollars per feu. Taken together, these indicators suggest that the main correction remains structural rather than abrupt, with limited weekly fluctuations. The market appears to be moving down in steps rather than through sharp swings, and short-term volatility is more contained than the scale of annual variations might suggest.
Drewry’s short-term outlook reinforces this interpretation. On Transpacific routes, prices are expected to hold up thanks to capacity management, while on China–European Union trades further weakening is forecast due to the imbalance between vessel supply and current demand. Operationally, and in line with the numerical data, capacity can temporarily support rates where it is visibly deployed. However, where supply remains abundant and demand does not accelerate, the downward trend persists. In this context, the distinction between “weekly stability” and “structural resilience” becomes crucial. The market may stabilise for several weeks without altering the fact that, on a year-on-year basis, many trades remain in marked decline.
P.R.